QQQM vs. QQQ in 2026: Fees, Liquidity and Long-Term Investing Compared

 Prefer us on Google


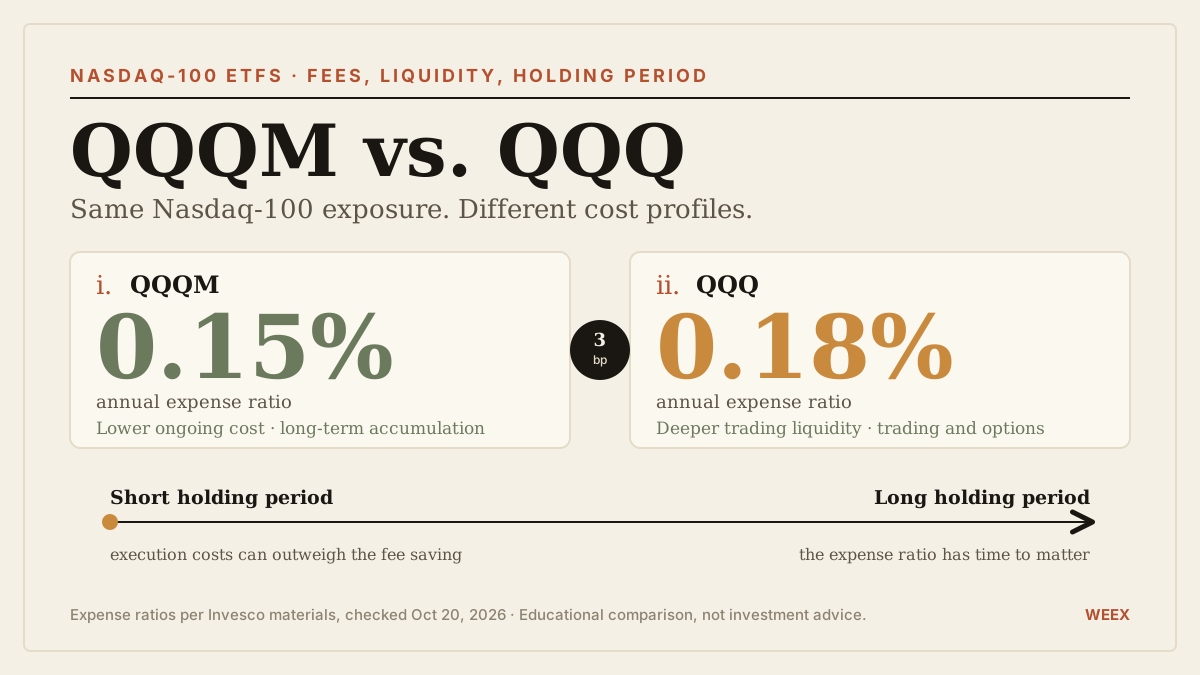
QQQM generally offers the stronger starting point for new, long-term Nasdaq-100 investments because its annual expense ratio is lower. QQQ can be more suitable when trading liquidity or a particular options strategy matters more. Invesco’s current comparison lists expenses of 0.15% for QQQM and 0.18% for QQQ, a difference of three basis points annually. Both seek to track the same index.
Our view is that this decision should be based on total costs and the investor’s actual use of the fund. QQQM’s fee advantage is real but modest. It does not automatically justify selling an existing QQQ position, paying avoidable taxes, or accepting poor execution. Conversely, QQQ’s greater trading liquidity has limited value to someone who rarely trades and does not need it.
By WEEX SEO Team
Published: October 20, 2026
Updated: October 20, 2026
Data Cutoff: October 20, 2026. Expense ratios were checked against current Invesco materials. Trading spreads, prices, and broker services can change.
What Is the Main Difference Between QQQM and QQQ?
The main practical distinction is the balance between ongoing fund expenses and trading functionality.
QQQM’s lower expense ratio favors investors who expect to hold their exposure for years. QQQ’s deeper secondary-market liquidity can matter more for investors placing large orders or trading over shorter periods. Invesco makes this distinction in its own product comparison.
The choice is not primarily about selecting different companies. It is about selecting a vehicle for substantially the same benchmark exposure.
| Question | QQQM | QQQ |
|---|---|---|
| Benchmark exposure | Nasdaq-100 | Nasdaq-100 |
| Current annual expense ratio | 0.15% | 0.18% |
| Main comparative advantage | Lower ongoing fund expenses | Greater secondary-market liquidity |
| Typical use case | Long-term accumulation | Trading or strategies requiring its market depth |
| Main cost to examine beyond fees | Actual execution conditions | Whether trading benefits justify higher ongoing expenses |
These are starting points, not universal instructions.
A small recurring purchase and a large short-term allocation can produce different answers. The same investor may also have different requirements for a retirement holding and a separate trading account.
The useful question is: Which vehicle costs less for the way you will actually use it?
Do QQQM and QQQ Hold the Same Investments?
Both funds seek Nasdaq-100 exposure, so their investment risks overlap substantially.
Nasdaq describes the benchmark as a modified market-capitalization-weighted index of 100 of the largest non-financial companies listed on the Nasdaq Stock Market. Larger constituents generally exert more influence than smaller ones, subject to the methodology.
This is not the same as owning the entire U.S. stock market.
It is also not a pure technology-sector index, although technology and related growth businesses can have substantial influence.
Holding both QQQM and QQQ does not meaningfully diversify the underlying exposure simply because the tickers differ. If a major shared holding declines, both funds can be affected.
Operational details, cash balances, expenses, and tracking outcomes may create small differences. That does not change the central relationship: these funds are close substitutes for the same portfolio role.
Before deciding between them, determine whether Nasdaq-100 exposure belongs in the portfolio at all.
A three-basis-point expense difference is less important than taking an unsuitable level of equity or concentration risk.
How Much Cheaper Is QQQM Than QQQ?
The difference between 0.15% and 0.18% is 0.03 percentage points, or three basis points.
One basis point equals 0.01 percentage points. Confusing percentage points with a percentage reduction can make a small annual saving sound much larger than it is.
The following table assumes a constant investment value for a year.
| Investment Value | QQQM Expenses at 0.15% | QQQ Expenses at 0.18% | Approximate Annual Difference |
|---|---|---|---|
| $1,000 | $1.50 | $1.80 | $0.30 |
| $10,000 | $15 | $18 | $3 |
| $50,000 | $75 | $90 | $15 |
| $100,000 | $150 | $180 | $30 |
| $500,000 | $750 | $900 | $150 |
These are simplified expense estimates. Actual dollar expenses vary with investment value and the fund’s expense-accrual process.
The interpretation is straightforward.
For a new long-term investment, there is value in avoiding an unnecessary recurring cost. For a small position, however, the difference may be less than a single avoidable trading charge or currency-conversion fee.
The expense ratio also is not usually a separate annual invoice deducted from the investor’s bank account. Fund operating expenses are reflected in fund assets and returns.
That is why comparisons should use net returns consistently.
-- Price
How Much Could the Fee Difference Compound Over Time?
A recurring expense difference can accumulate, but the size should be illustrated honestly.
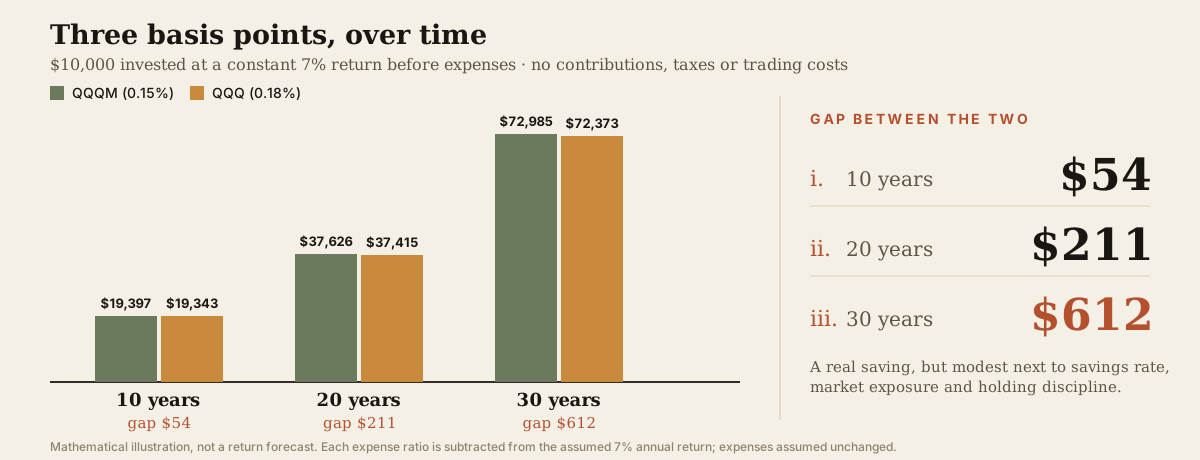
Assume a hypothetical $10,000 initial investment, a constant 7% annual return before fund expenses, no additional contributions, and no taxes or trading costs.
For simplicity, the calculation subtracts each expense ratio from the assumed annual return. Actual expenses accrue differently, and market returns do not follow a constant path.
| Holding Period | QQQM Illustration | QQQ Illustration | Difference |
|---|---|---|---|
| 10 years | $19,397 | $19,343 | $54 |
| 20 years | $37,626 | $37,415 | $211 |
| 30 years | $72,985 | $72,373 | $612 |
These are mathematical illustrations, not return forecasts. They assume expenses remain unchanged and all other fund outcomes are identical.
The model shows a genuine benefit from lower expenses. It also shows why exaggerated claims about the difference are unhelpful.
For this hypothetical investment, the result is not a dramatic transformation in retirement wealth. Larger balances or additional contributions would change the dollar effect.
The reasonable conclusion is to minimize avoidable costs while keeping the decision in proportion to the portfolio.
Market exposure, savings rate, holding discipline, and investment horizon can have much larger consequences.
Why Can Trading Liquidity Make QQQ More Cost-Effective?
An ETF’s expense ratio covers only part of the investor’s total cost.
Buying and selling can involve a bid–ask spread, commissions, market impact, and execution away from the expected price. ETF market prices can also differ from net asset value. The SEC’s investor guidance identifies these as important considerations beyond the expense ratio.
A more liquid trading environment can help some investors execute efficiently.
However, liquidity should be assessed for the actual order. Daily volume alone does not establish the cost of buying a specific number of shares at a specific moment.
Quoted spreads and available depth can change. An order that is small relative to the market can have different execution characteristics from a much larger one.
For a short holding period, a small difference in execution may exceed the annual fee saving accrued over that period.
For a long holding period, recurring expenses have more time to matter.
This is the economic reason the preferred fund can change with the investor’s use case.
What Is the Break-Even Holding Period for Higher Trading Costs?
A simple break-even calculation can connect execution costs with ongoing expenses.
Approximate break-even years = additional one-time trading cost ÷ annual expense saving
Consider a hypothetical $50,000 allocation. The three-basis-point annual saving is approximately $15 if the balance remains constant.
Now assume the total additional entry-and-exit cost of using QQQM, relative to QQQ, is:
| Hypothetical Additional Round-Trip Cost | Dollar Cost on $50,000 | Approximate Time to Recover Through Fee Savings |
|---|---|---|
| 1 basis point | $5 | 4 months |
| 3 basis points | $15 | 1 year |
| 6 basis points | $30 | 2 years |
| 12 basis points | $60 | 4 years |
These are assumed cost differences, not observed current spreads for either fund. The calculation ignores changing balances, taxes, and the time value of money.
The table does not establish that QQQM necessarily has those additional costs.
It provides a method: obtain the relevant execution estimates, calculate the difference, and compare it with the expected holding period.
An investor holding for several days should not justify a trade solely through an annual fee saving. Someone holding for decades should not automatically reject a lower-cost fund because of a small one-time difference.
Is QQQM Better for Monthly Investing?
QQQM is a reasonable starting point for recurring, long-term Nasdaq-100 purchases, but the brokerage arrangement matters.
The investor should check recurring-order support, fractional-share availability, commissions, currency-conversion costs, and how orders are executed.
These features are broker-specific. They should not be assumed from the ETF’s ticker.
For example, a hypothetical $1 charge on a $100 monthly purchase is a 1% purchase cost. That is much larger than the annual expense-ratio difference between the two funds.
Similarly, recurring foreign-exchange costs can outweigh a small saving in fund expenses.
The lowest expense ratio does not compensate for every expensive account setup.
A practical comparison therefore begins with the total amount invested and the full transaction process. If both funds are equally accessible and trading costs are comparable, QQQM’s lower ongoing expense is attractive for accumulation.
If access conditions differ substantially, calculate the combined cost rather than applying a universal rule.
Does a Lower Share Price Make QQQM a Better Investment?
A lower nominal share price does not mean a fund is more cheaply valued.
An ETF share represents a fraction of the underlying portfolio. The price per share depends partly on how the fund divides that portfolio into units.
A hypothetical $100 share is not automatically a better value than a $500 share if both provide proportional exposure to the same investments.
Nominal price can still affect convenience when a broker allows only whole-share purchases.
Suppose an investor contributes $200 at a time. A fund whose whole-share price exceeds that amount may leave cash waiting until a later purchase, unless fractional shares are available.
That is an implementation issue, not a valuation advantage.
Where fractional investing is available on comparable terms, the nominal-price distinction becomes less important.
Choose the exposure and cost structure first. Treat the share unit as a practical consideration.
Should Existing QQQ Investors Switch to QQQM?
An existing position requires a different decision from a new purchase.
For new money, the lower ongoing expense can be an uncomplicated advantage when other conditions are comparable.
Switching an existing holding may introduce trading costs, taxes, and a period of imperfect market exposure.
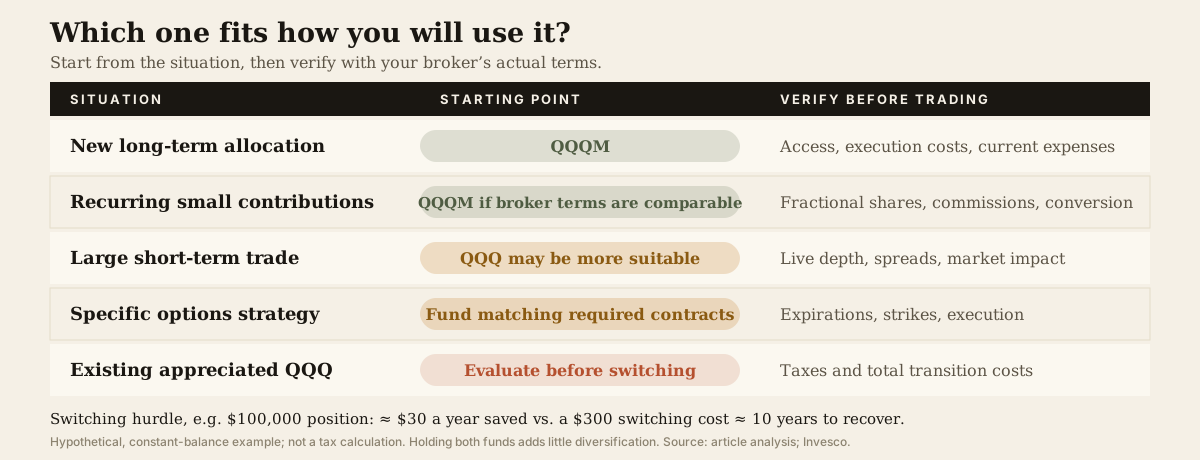
A simple example illustrates the hurdle. On a hypothetical $100,000 position, the annual expense saving is approximately $30 at a constant balance.
If changing the holding creates an immediate $300 cost, it would take roughly 10 years of those flat annual savings to recover that cost.
That is a simplified comparison, not a personalized tax calculation. Portfolio growth, future fee changes, and the timing of costs would affect the result.
A taxable sale can make the decision considerably more complicated. The relevant amount depends on the investor’s cost basis, jurisdiction, account, and applicable rules.
One alternative is to retain an existing position while directing new contributions toward the preferred vehicle. That can reduce the need for an immediate sale, although it does not create diversification between the two holdings.
The important point is that “QQQM is cheaper” does not automatically mean “sell QQQ today.”
What If You Use Options or Trade Frequently?
Options users should evaluate the specific contracts and strategy they need rather than assuming that the cheapest ETF is always the appropriate underlying.
Relevant considerations include available expirations, strikes, bid–ask spreads, contract depth, and the ability to enter and exit the intended position.
Those conditions can change and should be checked in the live market.
The comparison becomes particularly important when the strategy requires repeated transactions. Small execution differences can accumulate across entries, adjustments, and exits.
The ongoing ETF fee may be a minor part of the total strategy cost.
A covered-call strategy also changes the investment outcome. It is not simply the same long-term holding with extra income added without a trade-off. The option terms can affect upside participation and other risks.
Investors should therefore compare complete strategies, not only the fund tickers.
A useful distinction is between a long-term core allocation and a separate trading position. They can reasonably use different vehicles because they solve different problems.
Will QQQM Always Outperform QQQ?
A lower expense ratio provides an advantage when everything else is equal. It does not guarantee that one fund will outperform over every observed period.
Tracking outcomes can differ because of portfolio implementation, cash management, transaction costs, and the timing of distributions and other fund activity.
Investors also experience market-price returns, while published fund comparisons may use net asset value.
Those are related but different measurement points.
For a meaningful comparison, use the same start and end dates, the same return convention, and consistent treatment of reinvested distributions.
A price-only chart can misrepresent the result if it excludes distributions or uses inconsistent adjustments.
The expected benefit from lower expenses is small enough that short-period differences should not be overinterpreted.
Avoid turning a narrow return lead into proof of permanent superiority. The more useful question is whether the fund is delivering the intended exposure efficiently over a relevant period.
Does Buying Both Funds Reduce Portfolio Risk?
Holding both generally adds little diversification because their benchmark exposure overlaps.
An investor may still have operational reasons to use both, such as maintaining an existing position while directing new money elsewhere.
That arrangement should be understood as two vehicles serving similar exposure, rather than two independent sources of risk reduction.
Concentration deserves more attention.
Nasdaq-100 weighting can make portfolio results sensitive to a relatively small group of large companies. Owning many securities does not necessarily mean each contributes equally to risk.
Adding another fund that tracks the same benchmark does not solve that issue.
The asset-allocation decision comes before the wrapper decision. Determine how much Nasdaq-100 exposure is appropriate alongside other holdings, then select the implementation.
For many investors, avoiding unintended overlap will matter more than optimizing three basis points.
How Should You Choose Between QQQM and QQQ?
The decision can be organized around the intended holding rather than a universal ranking.
| Investor Situation | More Relevant Starting Point | What to Verify |
|---|---|---|
| New long-term allocation | QQQM | Access, execution costs, and current expenses |
| Recurring small contributions | QQQM when broker terms are comparable | Fractional shares, commissions, and conversion costs |
| Large short-term trade | QQQ may be more suitable | Live depth, spreads, and market impact |
| Specific options strategy | Fund matching the required contracts | Expirations, strikes, and execution |
| Existing appreciated QQQ position | Evaluate before switching | Taxes and total transition costs |
| Seeking diversification | Reassess portfolio exposure | Overlap and concentration |
This framework avoids two mistakes: overpaying for trading benefits that are never used, and creating large transition costs to capture a small annual saving.
Current fund documents and actual brokerage terms should settle the final choice.
Neither fund is automatically appropriate merely because the other appears less suitable.
FAQ
1. Is QQQM Better Than QQQ for Long-Term Investing?
QQQM generally has the stronger cost starting point for new long-term holdings because of its lower annual expense ratio. Trading conditions, broker costs, and existing-position consequences can change the decision.
2. What Are the QQQM and QQQ Expense Ratios in 2026?
The Invesco materials reviewed list 0.15% for QQQM and 0.18% for QQQ. The difference is three basis points annually. Check current documents before investing.
3. Does Holding Both Provide More Diversification?
Not meaningfully at the underlying benchmark level. Both seek Nasdaq-100 exposure, so their investment risks substantially overlap.
4. Should I Sell QQQ to Buy QQQM?
Not automatically. Compare the expected ongoing saving with trading costs and applicable tax consequences. Directing new contributions to the preferred fund may be an alternative.
5. Does QQQM’s Lower Fee Guarantee Higher Returns?
No. It provides a cost advantage with other factors equal, but tracking differences, distributions, execution, and measurement periods can affect observed returns.
WEEX Editorial View: Prefer Lower Ongoing Costs Without Ignoring Transition Costs
For a new, long-term Nasdaq-100 allocation with comparable brokerage access, QQQM is our preferred starting point.
QQQ remains relevant when its trading characteristics solve a real need. An existing holding should be evaluated on its own economics rather than sold reflexively.
The annual fee difference is worth capturing when doing so is inexpensive. It is not worth exaggerating.
Investors will make a better decision by comparing total costs over their intended holding period and ensuring that the underlying concentration fits their portfolio. The best implementation is the one that serves the strategy efficiently—not the ticker that wins a single-column comparison.
Sources
Invesco, Building Versatile Portfolios With the QQQ Innovation Suite, October 6, 2026.
Invesco, QQQ Innovation Suite: Fund Comparison, reviewed October 20, 2026.
Invesco, QQQ Fund Information and QQQM Fund Information, reviewed October 20, 2026.
Nasdaq, Understanding the Nasdaq-100 Index, reviewed October 20, 2026.
SEC Investor.gov, Updated Investor Bulletin: Exchange-Traded Funds and Mutual Fund and ETF Fees and Expenses, reviewed October 20, 2026.
This content is provided for general informational purposes only and doesn't constitute financial, investment, legal, or tax advice. Any events, rewards, online promotions, or related information mentioned herein should not be considered a recommendation, solicitation, or invitation to purchase, sell, trade, or otherwise deal in any crypto assets. Crypto assets are highly volatile and may result in loss. The availability of WEEX services, products, and related events may vary by region. You are responsible for ensuring that your participation is in accordance with applicable local laws and regulations.
You may also like

Bitcoin Expected to Outperform Major Assets in Annual Return Forecast

Tiger Research: The Second Growth Curve of the Korean Crypto Market - RWA and Compliant Stablecoins

Strive CEO Emphasizes Going Long on Bitcoin and Short on USD, Claims Currency Depreciation is Irreversible

Firelight forces XRP-linked tokens lockup as withdrawal delay queue grows

Strive’s new $500 million Bitcoin financing plan comes with a $257 million annual dividend problem

Ethereum Staking: Interactive Brokers Launches Service for Eligible Clients via ZeroHash

StoneX raises Securitize price target to 18, maintains buy rating

Bitcoin beats gold and stocks with 633% real return, study finds

Compound Community Proposes Transferring EPCF Fund Control to Multi-Signature Scheme
What Is Warren Buffett’s S&P 500 Investing Advice? Key Lessons for Volatile Markets
Learn Warren Buffett’s S&P 500 index fund advice, how the 90/10 rule works, and how to build a long-term plan for volatile markets.

Bitcoin Could Reach $500,000 by 2030, Says Strive CEO
Mary Daly: Future Rate Hikes Depend on Persistence of Inflationary Shocks

LONG Launches Community Vault LP Upgrade Feature, Supporting Stock Token Liquidity Provisioning

What is Concrete (CT) TGE? Can Institutional DeFi Drive More Gains?

BlackRock: AI Drives Adoption of Digital Assets, Stablecoins May Become Major Trading Tools

Strive CEO Aims to Increase Bitcoin Treasury Leverage Ratio to Over 60% This Year

Compound Foundation Accused of Improper Use of 8.42 Million DAI Reserves

Ethena Integrates Tokenized Assets in US Stock Market and Binance Perpetual Contract Hedging Strategy for USDe

NSE Stock Price Debuts Today at a Valuation Higher Than Nasdaq: Here's the Reason
NSE listed today at roughly 43 times earnings higher than Nasdaq, ICE, and Hong Kong Exchanges combined and analysts say investors aren't just pricing the exchange, they're pricing India's growth story.
Ye Tan: The Internet Era is Coming to an End, the AI Era has Already Begun

Nomura Warns of 'Double Whammy' Risk: The Next Market Storm May Start with Interest Rate Volatility

Bernstein Research Report: Why Can Gold Still Surge to $5,700 Even with Continued Rate Hikes by the Fed?

Volatility Shares Delays 3x XRP ETF Application to October 18, 2026

Tokenized stocks face 24/7 pricing gap: RedStone COO

HTX Research Examines Stock-Linked Memecoins: A New Connection Between Equity Assets and Crypto Liquidity

Raoul Pal Claims Bitcoin Outperforms Gold as Hedge Against Debasement

Treehouse Expands tETH Lending Market to Compound V3
Dell Stock Jumps 12% to a Record High: Is the AI Server Boom Just Getting Started?

BIT Analyst Says Fed's Pause on Rate Hikes Could Boost Q4 Crypto Market

Compound opens USDC market with up to 87% LTV
Bitcoin Expected to Outperform Major Assets in Annual Return Forecast
Tiger Research: The Second Growth Curve of the Korean Crypto Market - RWA and Compliant Stablecoins
Strive CEO Emphasizes Going Long on Bitcoin and Short on USD, Claims Currency Depreciation is Irreversible
Firelight forces XRP-linked tokens lockup as withdrawal delay queue grows
Strive’s new $500 million Bitcoin financing plan comes with a $257 million annual dividend problem
Ethereum Staking: Interactive Brokers Launches Service for Eligible Clients via ZeroHash